Working From Home? Monitor Your Air Quality in Real-Time
from hackster.io
Over the last several months, many people have had to improvise a home office as many businesses move to remote work for the foreseeable future. While this certainly has its benefits, especially now, there are a few ways that spending nearly 24/7 in a residential building differs from working in an office — what are the health impacts?
Most offices will have some measure of air handling units, air conditioners, and fans to circulate air, though often residences do not, and air quality is an important factor in overall health.
Whereas air quality meters on the market are expensive and may not be of much use to the average person, a DIY meter can reduce cost and be set up to present data in ways that can be much more useful.
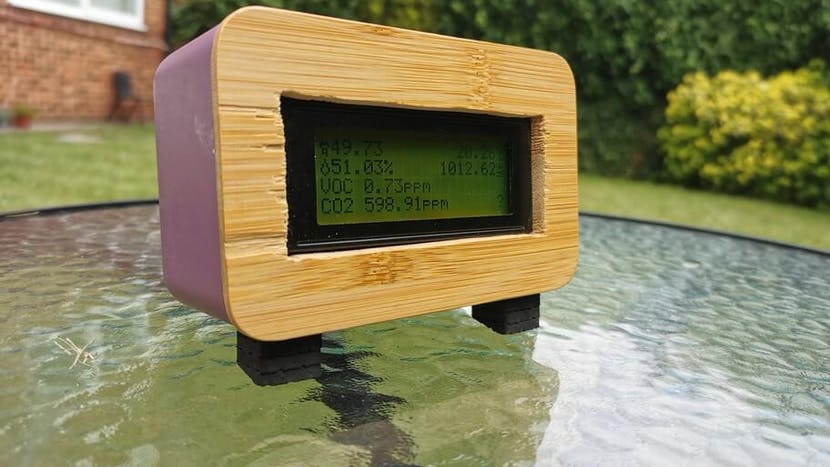
One such project is available online, documenting an air quality meter that displays data on an LCD, reports live air quality to an MQTT broker, and allows real-time monitoring on any device that can do MQTT.
The meter also incorporates a Raspberry Pi, which persists data to an InfluxDB instance and hosts a Grafana interface, enabling graphing of data over time.
The build requires only a few components. The controller is a Wemos ESP32 board, which is ideal for IoT sensor hub applications — two 240MHz cores and a third “low power” core, 520KB of SRAM, WiFi, Bluetooth, 34 GPIO Pins, 12 bit ADC, and SPI and 12C support. Code can be written for the ESP32 in a number of ways, including using the Arduino IDE.The external display used is an I2C LCD display, a text-only display with an interface board already soldered on. The sensor board used as an indoor environment monitor is the BME680 module that measures temperature, pressure, humidity, and gas resistance.
A Raspberry Pi 3B+ was used to make the data more accessible, although it would also be possible to use another server you control.
Writing code for the sensor requires installing the Arduino IDE, which simplifies coding for embedded systems a little bit, as well as the ESP32 dev tools, and libraries compatible with your sensor board and display.
The full code used by the project developer is available on his sight as an example, along with a model of the dashboard setup used in Grafana. Much less expensive and easier to customize than any sensor you could purchase, the finished product will give you a sense of several indoor environmental conditions and how they vary over the day and week.


Leave a comment